Penticton Housing Market Update – April 2026
Spring arrived with purpose in April. Sales activity picked up, dollar volume jumped, and the numbers overall reflect a market that’s finding its footing after a cautious start to the year. That said, not every indicator points in the same direction, and as always, the details matter more than the headline.
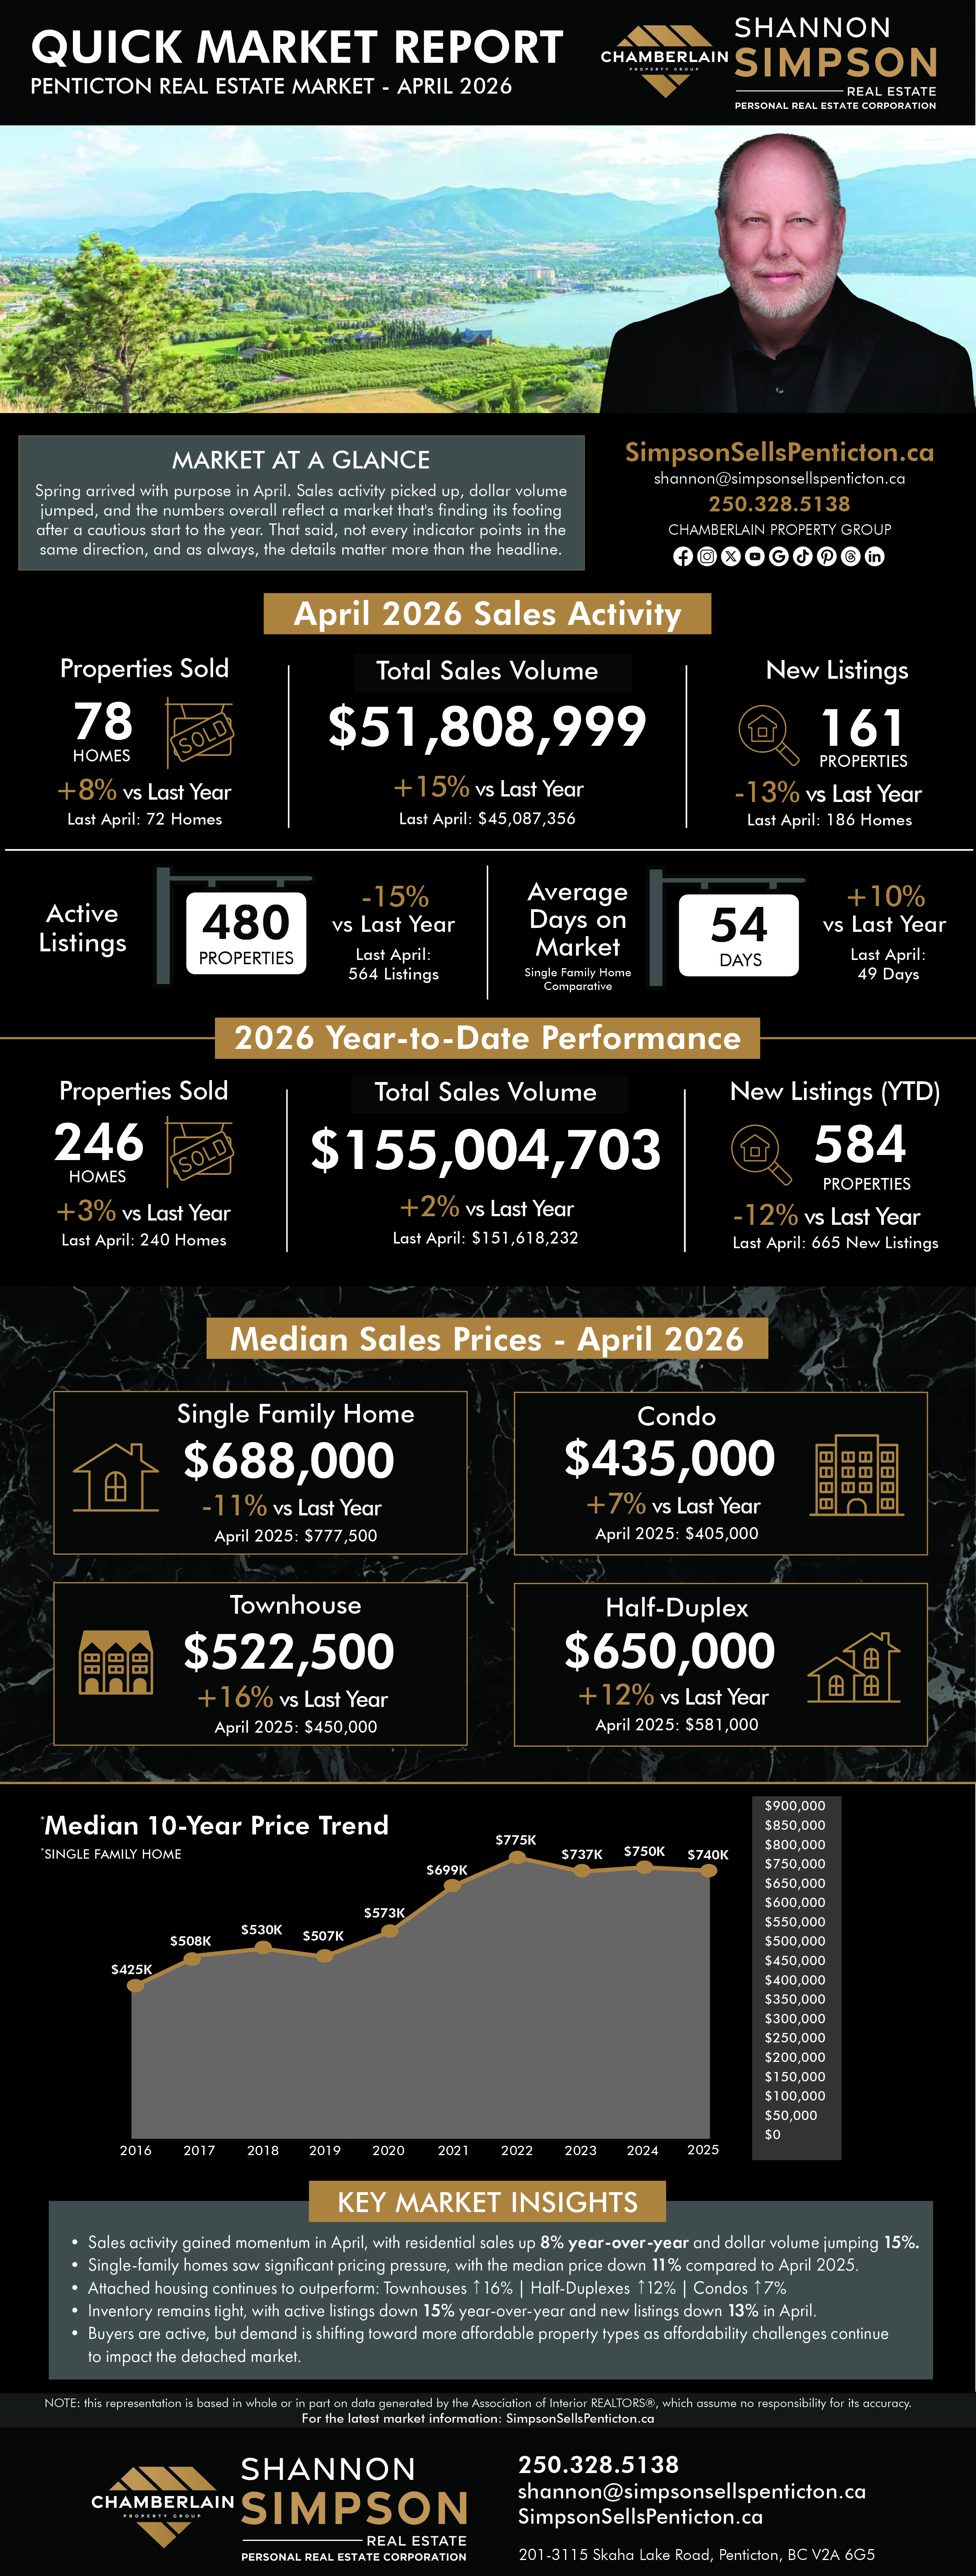
Penticton recorded 78 sales in April, up 8% from 72 in April 2025, with total dollar volume reaching $51.8 million, a 15% increase over last year’s $45.1 million. That dollar volume jump, outpacing the unit sales increase, suggests the mix of properties sold in April skewed toward higher price points. On the supply side, 161 new listings came to market, down 13% from 186 a year ago. Year-to-date, 246 properties have sold, up a modest 3% over the same period in 2025, with cumulative dollar volume of $155 million, up 2%. New listings for the year sit at 584, down 12% from 665 at this point last year. The consistent theme through the first four months of 2026: buyers are active, but sellers are cautious about coming to market.
Prices and Property Types:
- Single‑Family homes: Median price sits at $688,000, down 11% from $777,500 last April. This is the number that demands attention in April’s report. An 11% year-over-year decline in the SFH segment is not a rounding error. It reflects real pricing pressure in the category that most buyers and sellers track most closely.
- Condos: Median price at $435,000, up 7% from $405,000. A solid gain that continues a trend of relative strength in the attached entry-level segment.
- Townhouses: At $522,500, up 16% from $450,000. The standout performer of the month, a meaningful jump that reflects genuine demand in this category.
- Half Duplexes: $650,000, up 12% from $581,000. Consistent with the broader story that attached housing is holding and gaining while detached softens.
The divergence between single-family and attached property pricing is the defining feature of this market right now, and it’s worth understanding rather than glossing over. Buyers priced out of detached homes are finding value in townhouses, condos, and half-duplexes, and that demand is showing up clearly in the numbers.
Market Pace and Inventory:
Single-family homes averaged 54 days on market in April, up from 49 days last year, a 10% increase. Not alarming, but a signal that detached buyers are taking more time, which is consistent with the pricing pressure we’re seeing in that segment. Active inventory sits at 480 listings across all categories, down 15% from 564 at this time last year. The combination of fewer new listings coming to market and shrinking overall inventory is a dynamic worth watching as we move through spring.
What This Means for You:
- For sellers: If you’re selling an attached property, townhouse, condo, or half-duplex, April’s numbers are encouraging. Demand is translating into price gains, and those segments are moving with confidence. If you’re selling a single-family home, the conversation about pricing needs to be grounded in current reality, not last year’s expectations. The 11% median price decline is a clear signal that the market will not reward optimistic pricing in this category.
- For buyers: Inventory continues to tighten year-over-year, and attached housing is getting more competitive and more expensive. If you’ve been watching from the sidelines, the conditions that made 2024 and early 2025 comfortable for buyers are gradually shifting. That doesn’t mean urgency for urgency’s sake, but it does mean that patience has a diminishing return in certain segments.
- For everyone: April’s data reinforces what’s been building for several months. This is not a uniform market. It behaves differently depending on property type, price point, and neighbourhood. Decisions made without understanding those distinctions are decisions made with incomplete information.
My Take:
April was a genuinely active month, and the unit sales and dollar volume numbers are both encouraging. But the 11% drop in single-family median pricing is hard to set aside, and I don’t think it should be. In a month where total dollar volume was up 15%, seeing the most closely watched segment soften that sharply suggests the gains are being driven by attached housing, not by a broad-based market recovery.
The supply picture adds another layer of complexity. Fewer sellers are listing, down 12% year-to-date, and total inventory is 15% below last year. In a normal market, that kind of supply contraction would push prices up across the board. The fact that SFH prices are still declining despite tighter inventory tells me there’s a ceiling on what some buyers are willing (or able to pay) in that segment, likely tied to financing conditions and affordability limits.
What I find most interesting, and most worth watching, is the townhouse number. A 16% median price increase is a significant move. If that trend holds into May and June, it will tell us something important about where buyer demand is actually concentrating in Penticton right now.
The year-to-date picture, up 3% in unit sales and up 2% in dollar volume, describes a market that is marginally better than last year but not dramatically so. Spring is delivering activity, and that’s a good sign. Whether that momentum builds or levels off through May will tell us a great deal about how the second half of 2026 is likely to unfold. For now, April is a step in the right direction, with some important caveats attached.
Remember, if you have any questions, I’m always here to help you MAKE SENSE OF IT ALL!