
Penticton Housing Market Update – August 2026
August broke the five month streak of building momentum, and the reason is squarely local rather than a change in underlying demand. A wildfire broke out in Summerland on August 7, and showings across the South Okanagan slowed to a near standstill for the better part of three weeks. Evacuees were allowed back into their homes on August 18, but activity stayed slow well past that point, and the disruption to the month’s activity ran the length of the standstill. Nationally, the backdrop stayed cautious as well: the Bank of Canada held its key lending rate at 2.25% again on September 2, a seventh consecutive hold, citing the continuing conflict in the Middle East, new U.S. tariffs, and Canada’s countermeasures as sources of ongoing uncertainty, even as the broader Canadian economy showed a genuine recovery in the second quarter. Locally, the story this month is less about a shift in fundamentals and more about a market that quite literally paused.
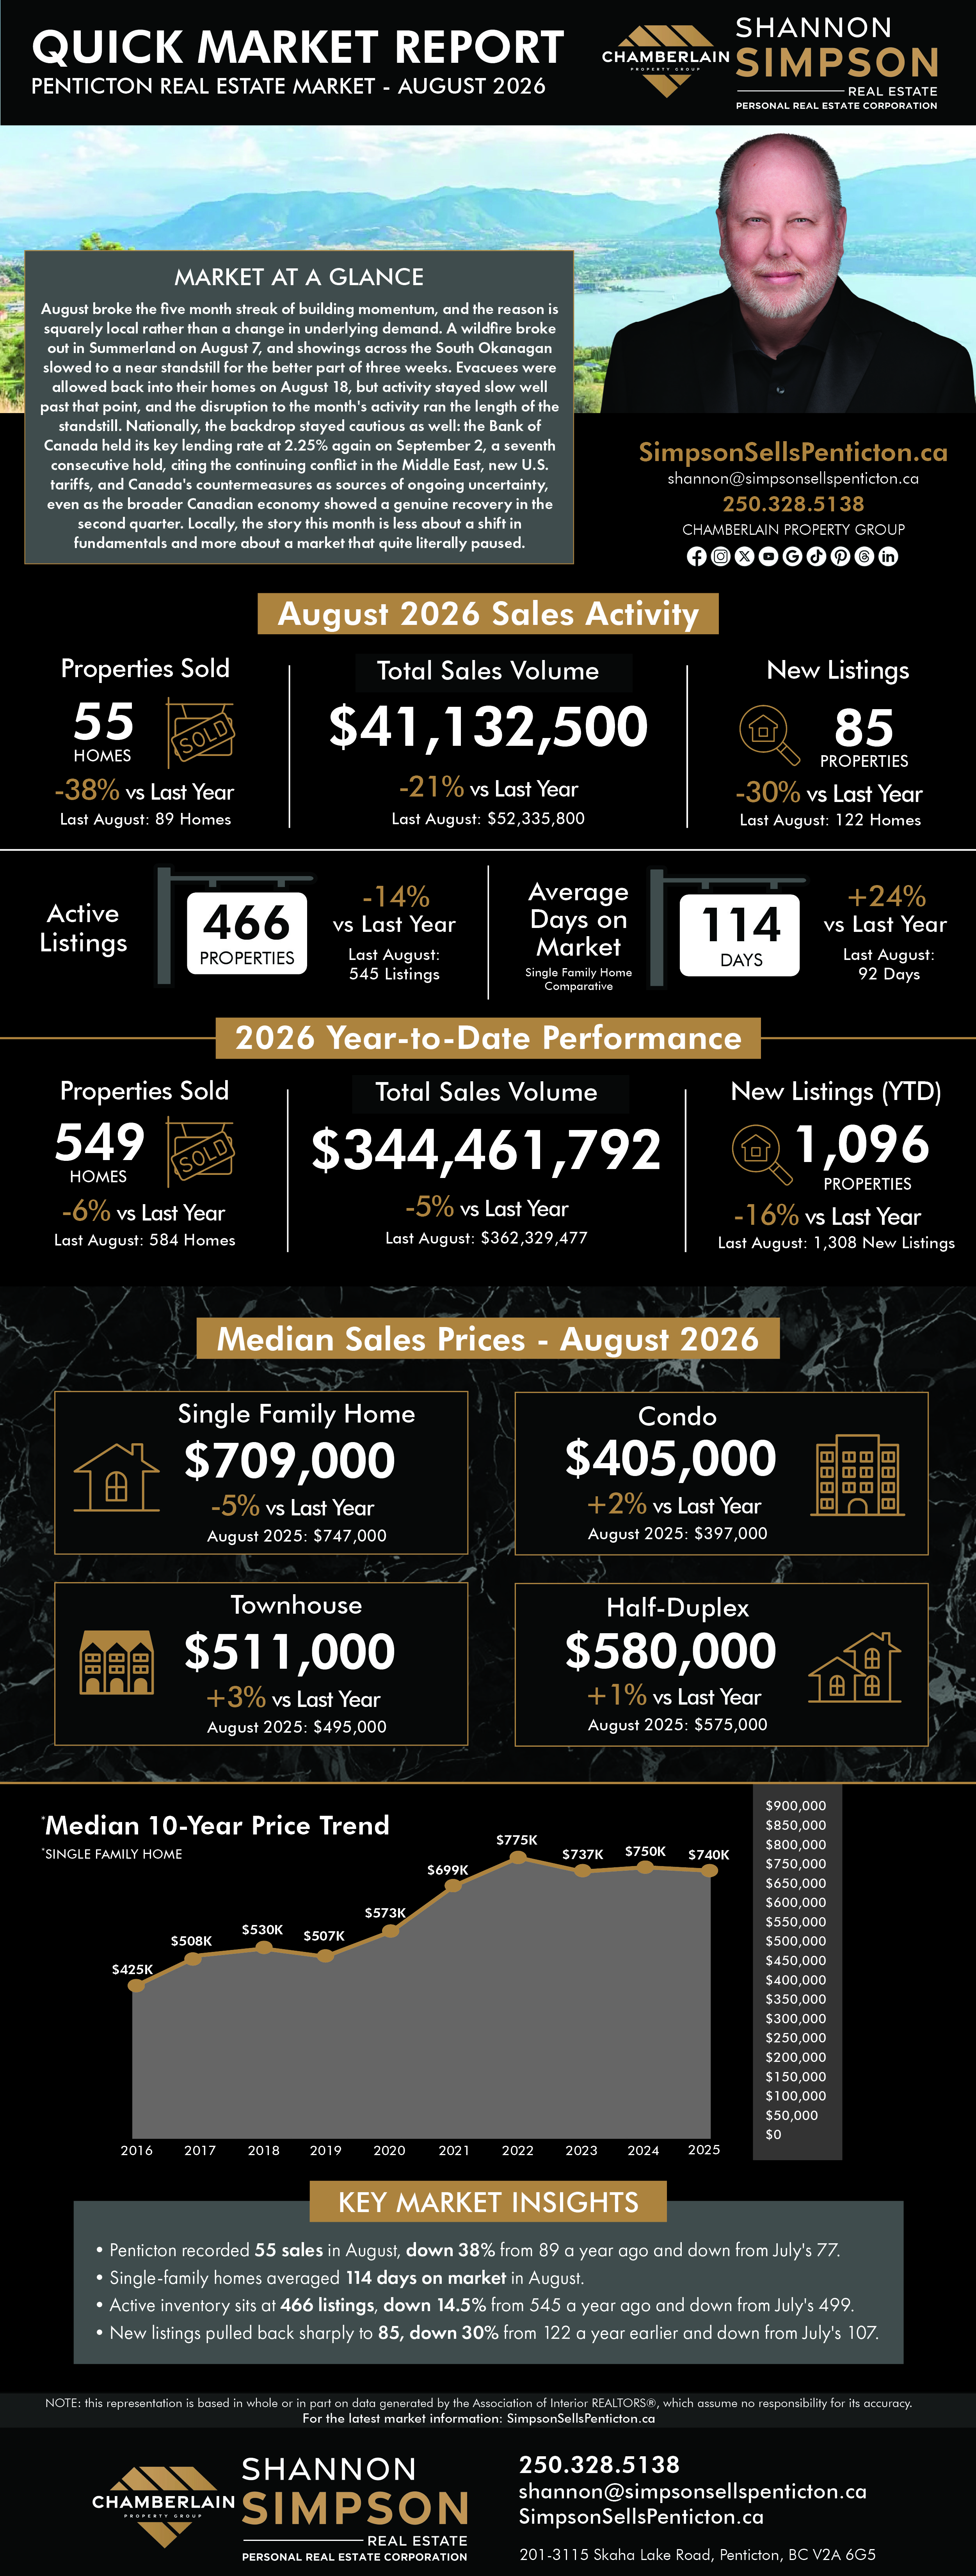
Penticton recorded 55 sales in August, down 38% from 89 a year ago and down from July’s 77, the softest month of the year by a wide margin. Total dollar volume came in at $41.1 million, down 21% from $52.3 million last August and down from July’s $44.6 million. New listings also pulled back sharply to 85, down 30% from 122 a year earlier and down from July’s 107. It’s worth flagging that with only 55 sales this month, dollar volume is more sensitive than usual to individual transactions: a single $8.85 million acreage property accounted for more than a fifth of August’s total volume on its own. Year to date, 549 properties have sold, down 6% from 584 over the same period in 2025, with cumulative dollar volume of $344.5 million, down 5%. New listings for the year sit at 1,096, down 16% from 1,308 at this point last year. The year to date figures remain close to last year’s pace; it’s August specifically that took the hit.Prices and Property Types:
Single-Family Homes: Median price sits at $709,000, down 5% from $747,000 last August. That’s a narrower year-over-year gap than July’s 8% decline, and the median actually held essentially flat month over month, up about $4,000 from July’s $705,000. With sales activity this thin, a handful of properties can move the median considerably, so I wouldn’t read too much into the narrowing on its own, but it’s a smaller decline than we’ve seen in recent months.Condos: Median price at $405,000, up 2% from $397,000, and essentially unchanged from July’s $403,000. The entry-level attached segment continues to hold its ground.
Townhouses: At $511,000, up 3% from $495,000, though down from July’s $520,000. Fewer transactions this month make the month-over-month move less meaningful than the sustained year-over-year gain.
Half-Duplexes: $580,000, up 1% from $575,000, and unchanged from July. This is the smallest sample of the four categories, so treat the flat read as exactly that.All three attached categories still posted year-over-year gains in August, and single-family softness moderated rather than deepened. That’s consistent with the broader pattern from earlier in the year, though with sales volumes this low across the board, one month’s numbers carry less weight than usual, and I’d want to see September’s activity before reading a genuine change into the single-family trend.
Market Pace and Inventory:
Single-family homes averaged 114 days on market in August, up from 92 a year ago, an increase of about 24%, and nearly double July’s 60 days. Some of that is a direct byproduct of the fire: showings paused for the better part of three weeks, and listings that would ordinarily have sold inside a month simply sat longer through no fault of pricing or presentation. Active inventory sits at 466 listings, down 14.5% from 545 a year ago and down from July’s 499. Months supply of inventory came in at 6.95, down from 7.85 last August, an 11.5% decrease. Inventory is still contracting on a year-over-year basis, but the drop in new listings this month, down 30% year over year, is at least partly a function of sellers holding back during and immediately after the evacuation rather than a deepening supply shortage.
What This Means for You:
- For sellers: If your listing sat longer or saw fewer showings in August, the fire is very likely the reason, not your price or your presentation. I’d expect activity to pick back up through September as the community settles back in. If you’re in the single-family category, pricing discipline still matters. The year-over-year decline narrowed but didn’t disappear, and an interrupted month is not the same as a stronger market.
- For buyers: If you were shopping in August and found fewer open houses and slower responses, that was the fire, not a lack of genuine interest from sellers. Inventory is still down year over year, so don’t expect a flood of new choices, but a market that paused for the better part of three weeks can also mean less competition on the listings that stayed active. Worth watching closely through September.
- For everyone: August was an unusual month, and the numbers reflect that more than they reflect any real shift in the underlying market. Sales, listings, and days on market all moved in a direction that lines up with roughly three weeks of disrupted activity. I’d treat this month as an outlier to be read in context, not a new trend to extrapolate from.
My Take:
August was always going to be a quieter month once the Summerland fire started on the 7th. Showings across the region were pretty much non-existent for the better part of three weeks, and a 38% year-over-year drop in sales, on top of a 30% drop in new listings, tracks with that disruption almost exactly. I don’t think this is a market cooling off so much as a market that was paused mid-sentence.
That said, a couple of numbers are worth watching rather than dismissing. Single-family days on market jumped to 114 from 92 last year and from 60 in July, nearly double the prior month. Part of that is mechanical: listings that were active through the fire simply couldn’t be shown, so their time on market kept climbing while nothing else about them changed. But I’d want to see it come back down through September before writing it off entirely. If it’s still elevated once the market has had a real chance to reopen, that would tell a different story.
The single-family median’s year-over-year decline narrowed to 5% from July’s 8%, which on its face reads as good news for detached pricing. I’d hold that lightly, though. With sales volume this thin, one or two properties can move a median meaningfully, and I don’t have enough data this month to call it a genuine turn. The attached categories, condos, townhouses, and half-duplexes, all posted modest year-over-year gains again, continuing the pattern that has held for most of the year.
One more flag on the dollar volume: a single $8.85 million acreage sale made up more than a fifth of August’s total, which pulls the average sale price figures well above what a typical transaction looked like this month. I’m relying on the median prices by category above rather than the averages for that reason.
Nationally, the Bank of Canada held its rate at 2.25% again on September 2, its seventh straight hold, with the conflict in the Middle East and the new round of U.S. tariffs and Canadian countermeasures cited as the main sources of uncertainty. None of that is Penticton specific, but it means financing costs are not shifting meaningfully in either direction heading into fall.
My honest read: August tells us more about a wildfire than it does about the direction of this market. The real test is September, once showings have fully resumed and there has been enough time to see a genuine month of activity. I’d treat this month’s numbers as real but not representative, and I’ll have a clearer picture to share once next month’s data comes in.
Remember, if you have any questions, I’m always here to help you MAKE SENSE OF IT ALL!